Observability in Practice: Monitoring Serverless Architectures with AWS Lambda, X-Ray, CloudWatch and Grafana
In this article, I demonstrate how to apply observability in serverless applications using AWS. Through a real-world example, we explore metrics, traces, and dashboards for efficient API monitoring.

This article is a practical continuation of our previous post "Observability in the Modern Backend". While the first article focused on the concepts and pillars of observability, this one dives deep into implementing a real-world use case using AWS Lambda, CloudWatch, X-Ray and Grafana.
All the code used in this example is available on GitHub: betonr/lambda-observability. You can easily deploy the full scenario using Terraform and test the entire monitoring setup yourself.
=> Tools We'll Use
- AWS CloudWatch: Native AWS monitoring service with logs, metrics, alarms, and basic dashboards.
- AWS X-Ray: Tracing service to visualize and analyze request paths across distributed applications
- Grafana: Open source visualization platform, perfect for beautiful and insightful dashboards.
🚀 The Project in Practice
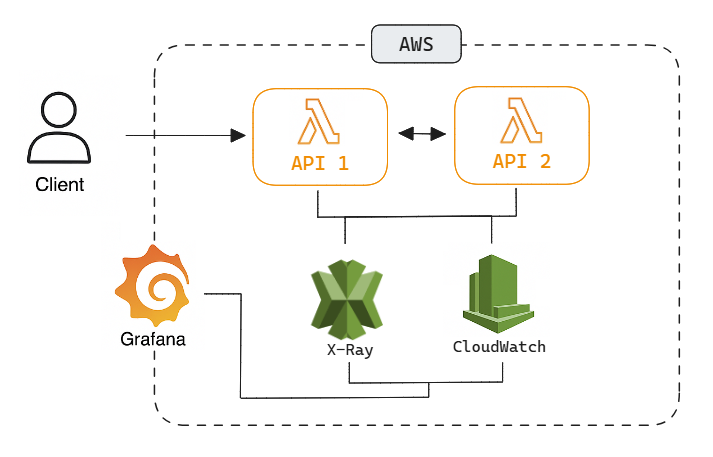
To demonstrate this setup, we built two small Go APIs that simulate inter-service communication via REST. Both services are deployed on AWS Lambda and instrumented with X-Ray for trace collection. API 1 receives a request and forwards it to API 2 via internal HTTP, simulating real-world service-to-service communication.
Highlights:
- Deployed via Terraform
- Build & deploy with Makefile
- Shared env vars between Lambdas via
terraform output - Integrated X-Ray and CloudWatch
- Local dev with
aws-lambda-go-api-proxy
Real-world analogy: API 1 could be a checkout handler calling API 2 for fraud analysis.
Here's a snippet of the X-Ray initialization used in each Lambda function:
import "github.com/aws/aws-xray-sdk-go/xray"

xray.Configure(xray.Config{
  LogLevel:       "info",
  ServiceVersion: "1.0.0",
})
The APIs communicate with each other, and every incoming/outgoing request is traced. By using http.Client wrapped with X-Ray's instrumentation, we ensure the trace context is passed forward:
client := xray.Client(&http.Client{})
req, _ := http.NewRequest("GET", os.Getenv("SECOND_API_URL"), nil)
xray.Capture(ctx, "call-second-api", func(ctx context.Context) error {
  _, err := client.Do(req.WithContext(ctx))
  return err
})
Architecture Diagram
📈 What Can We Extract?
With the setup in place, we gain visibility into:
- API latency between services
- Execution time of each function
- Error traces and where they occurred
- Invocation count and throttling
Here are some example metric queries you can build in Grafana (or even in CloudWatch dashboards):
Metric: AWS/Lambda
Statistic: Duration
Filter: FunctionName = api1

Metric: AWS/XRay
Type: Trace Count by HTTP Status
Filter: Service = api2, Status = 500
Query Examples
-- Avg duration per function
filter @type = "REPORT"
| stats avg(@duration) by @logStream

-- Total invocations in last 30min
filter @type = "REPORT"
| stats count(*) by @logGroup

-- Errors only
fields @timestamp, @message
| filter @message like /ERROR/
| sort @timestamp desc
📊 6. Visualizing in Grafana
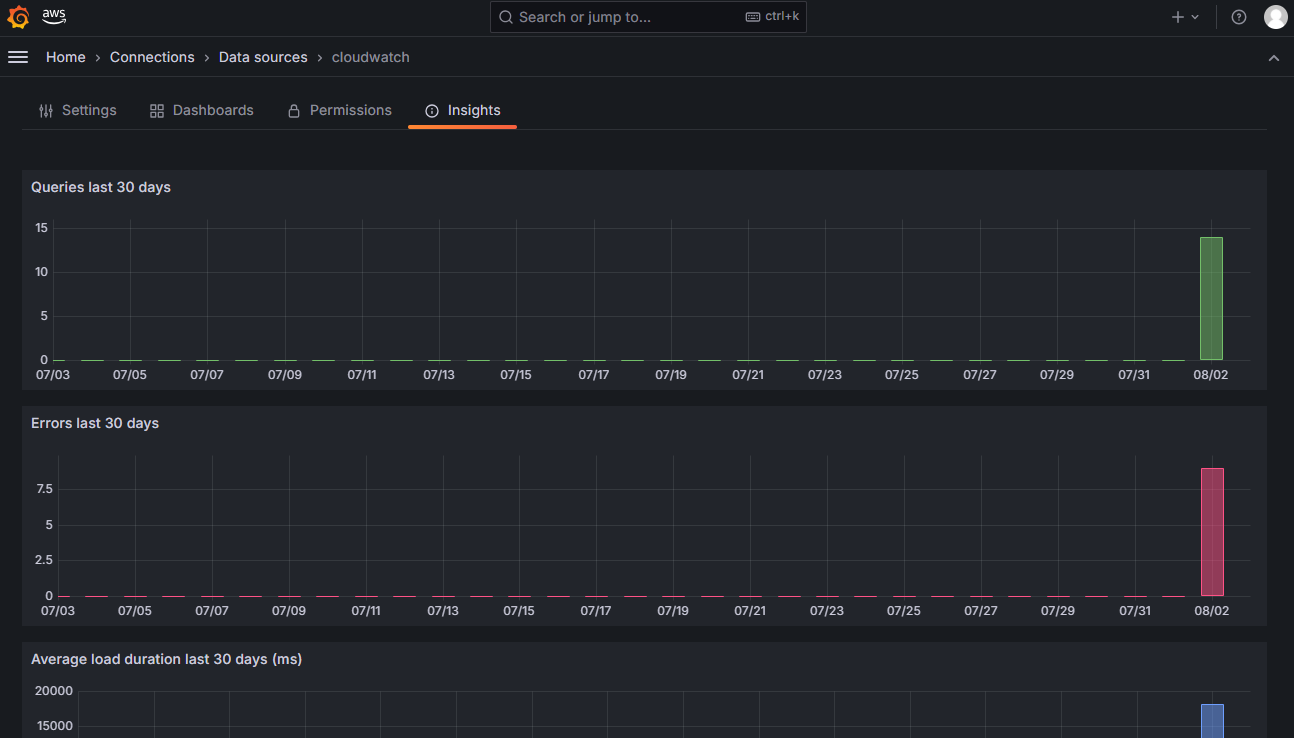
Grafana can be integrated with CloudWatch and X-Ray using the CloudWatch datasource. After configuring IAM roles with read access to logs and metrics, you can create dashboards that include:
- Average latency between APIs
- Error rate by Lambda function
- Heatmaps for request durations
- X-Ray service maps embedded directly into panels (via plugin or screenshots)
Pros: friendly UX, sharable dashboards, advanced visuals
Cons: needs setup, may add cost if not self-hosted
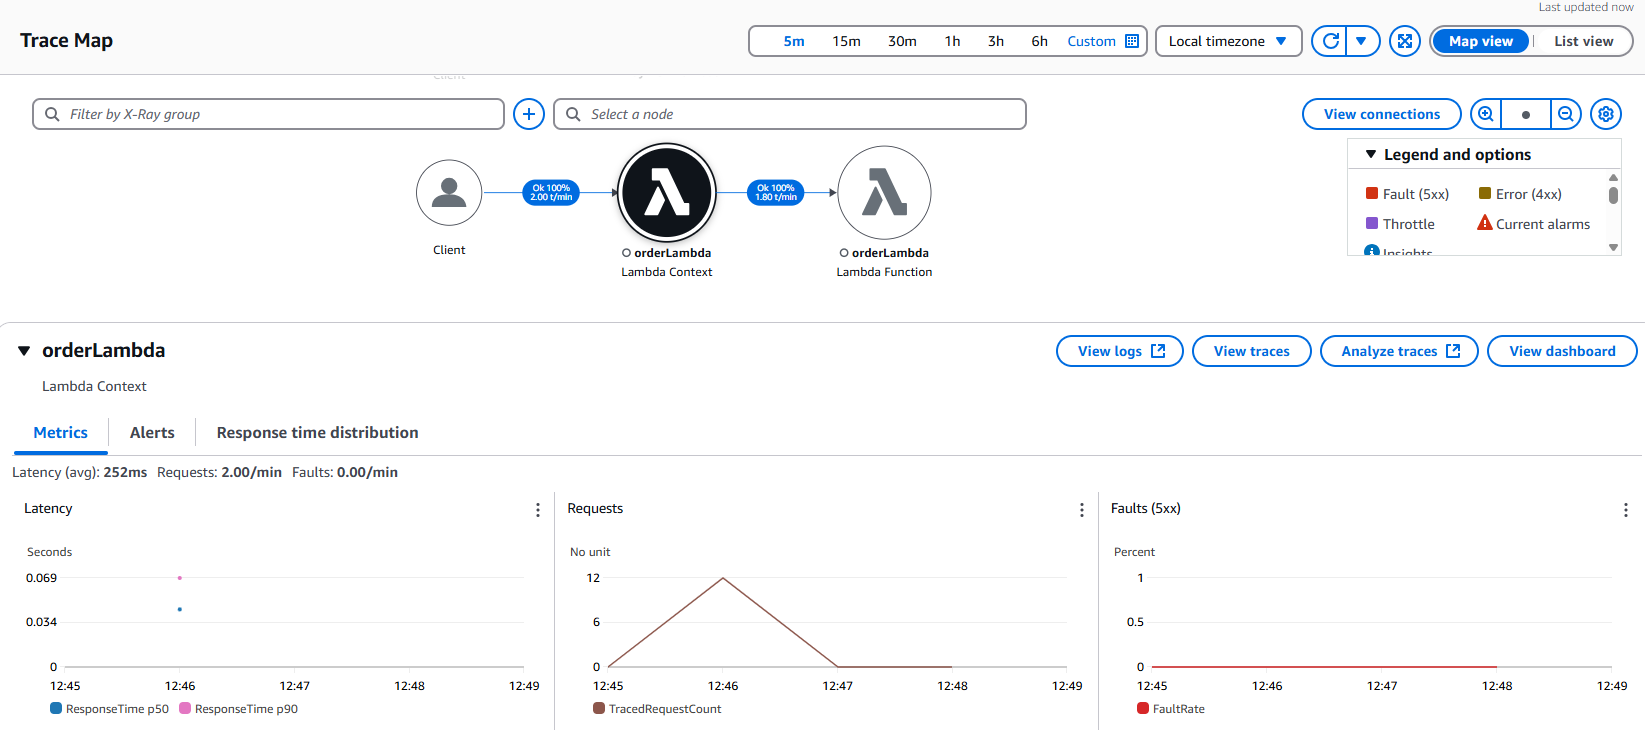
You can check some sample screenshots from our test environment below:
💸 Cost Considerations
While the entire setup is serverless and highly scalable, it's important to consider the cost structure:
- CloudWatch charges based on logs ingested, metrics stored and API calls
- X-Ray charges per trace segment recorded and scanned
- Grafana (if self-hosted) incurs EC2 or ECS costs, otherwise Grafana Cloud may apply tiered pricing
For development and low volume environments, AWS free tier often covers most of the usage, but in production it's essential to monitor the cost dashboard to avoid surprises.
Conclusion
This article showed how to implement observability in a real-world, serverless scenario using AWS native tools and Grafana. This approach provides a solid foundation for monitoring modern distributed applications.
That said, depending on your use case and scale, other solutions like Datadog, New Relic or Dynatrace may provide additional benefits such as deeper insights, anomaly detection, or even APM out-of-the-box. The important thing is to choose tools that align with your project goals and operational needs.
🔗 Code available at: github.com/betonr/lambda-observability