Observability in the Modern Backend: Fundamentals, Tools, and Trade-offs for Scalable Systems
Explore the key concepts and tools for implementing observability in modern backend systems, including logging, monitoring, and tracing.

Observability goes far beyond just having logs. In distributed and modern systems with multiple services, integrations, and simultaneous users, being able to understand what's happening is crucial to ensure performance, stability, and the ability to scale safely.
In this article, we'll explore the pillars of observability, the main tools available (free and paid), the necessary precautions, and how to design the backend to favor efficient observability.
Monitoring vs Observability
Many people confuse monitoring with observability, but there is a fundamental difference. Monitoring focuses on tracking known metrics and events — what we already expect and configure to observe. It's essential for detecting when something goes off track, like a latency spike or increased errors.
Observability, on the other hand, is the system's ability to provide enough information to understand what's happening internally, even during unexpected behavior.
In other words, while monitoring answers "Is everything okay?", observability allows us to investigate "Why is this happening?" The combination of both ensures stable and reliable operations in modern systems.
🧱 The Three Pillars of Observability
- Logs: Detailed records of events occurring in the system, usually with timestamps. A well-structured log helps understand exactly what happened at a given moment.
- Metrics: Aggregated numerical data that lets you track system behavior over time. Ideal for identifying trends, bottlenecks, and triggering automated alerts.
- Traces: Distributed records that allow you to follow the complete path of a request through different services, identifying where time is spent and where failures occur.
Together, these pillars provide a complete picture of system state and behavior. None of them alone is sufficient for full observability.
* The Importance of Good Metrics
Metrics are essential for maintaining system health. They help detect real-time problems and allow historical analysis for performance and capacity planning. Well-defined metrics enable data-driven decisions — such as scaling a service, optimizing a route, or prioritizing bug fixes.
Important examples include average response time, error rate, number of requests per second, CPU and memory usage per service, queue sizes, etc. High-cardinality metrics (like per-user or per-endpoint) should be used with care to avoid impacting the performance of the observability platform itself.
Key Requirements for an Observable System
- Structured logs with context (e.g., using
zap,logrus, orstructlog) - Distributed tracing with
trace_idpropagation - Real-time metrics with alerts and dashboards
- Proper context propagation (e.g.,
context.Contextin Go, middleware in Python) - Correlation between logs, metrics, and traces
- Consistent naming conventions across services
- End-to-end tracing including frontend and backend
=> Open Source Tools (Low Usage Cost, High Implementation Cost)
More flexibility, more responsibility.
- Prometheus (metrics)
- Grafana (dashboards)
- Loki (logs)
- Jaeger or Tempo (tracing)
- OpenTelemetry (unified instrumentation)
- ELK Stack (ElasticSearch + Logstash + Kibana)
- Thanos (Prometheus scalability)
=> Managed Tools (Low Effort, Higher Cost)
Less code, more convenience.
📊 Tooling by Project Profile
| Project | Suggestion | Rationale |
|---|---|---|
| MVP / Startup | OpenTelemetry + Tempo | Zero cost, flexible, harder to maintain |
| Mid-size Project | AWS CloudWatch + X-Ray | Integrates well with AWS, reasonable setup |
| Scalable Systems | Datadog or New Relic | Deep observability, lower operational overhead |
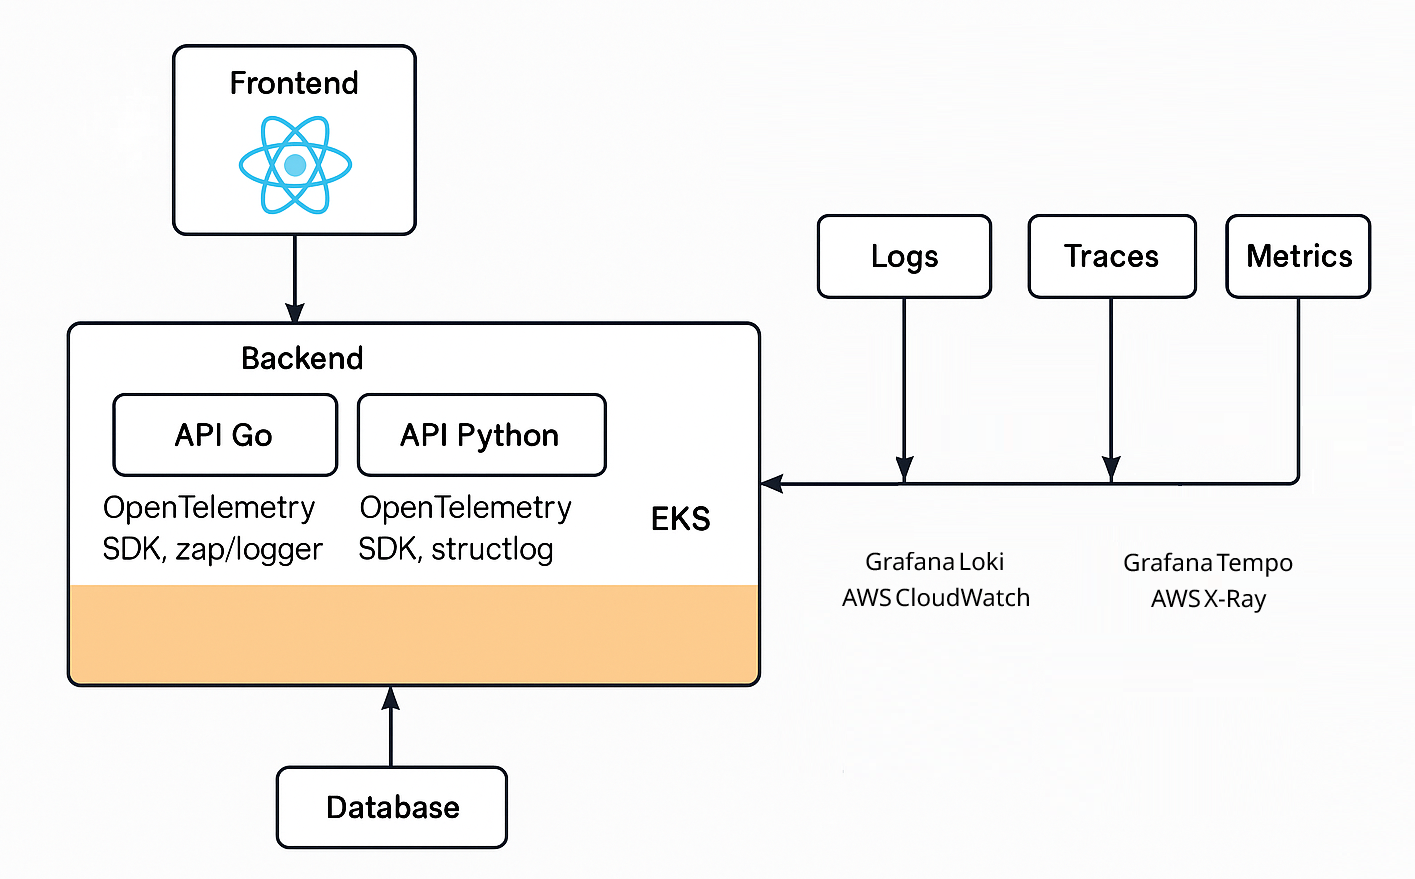
🔬 Practical Example: Observability with AWS EKS
Imagine a system with:
- Frontend: React hosted via CloudFront + S3
- Backend: APIs in Go and Python
- Infrastructure: Services in containers on Amazon EKS
- Database: PostgreSQL (RDS), Redis, SQS
Suggested Tooling by Layer:
- Frontend: Sentry, OpenTelemetry JS (error tracking, trace start)
- Go APIs: OTel SDK + zap/logger (trace propagation)
- Python APIs: Auto-instrumentation + structlog (easy FastAPI/Flask support)
- Logs: Loki or CloudWatch Logs (with trace_id)
- Traces: Tempo or AWS X-Ray
- Metrics: Prometheus + Grafana or CloudWatch
- Alerts: Alertmanager or Grafana Alerts
Context propagation is essential. Using sidecars or DaemonSets for OpenTelemetry agents in EKS helps centralize collection. For smaller teams, SaaS solutions like Datadog may provide better productivity.
✅ Best Practices and Precautions
- Limit metric cardinality
- Avoid collecting excessive or sensitive data
- Define clear ownership of alerts
- Test alert thresholds in staging before production
Final Tip
There is no single perfect stack for every situation. Each system has its own context, budget, and team constraints. What matters most is:
- Start simple
- Measure what matters
- Evolve based on real-world pain points
Coming Up Next
In future posts, I'll explore this topic further by implementing a real-world version of the example above, complete with open-source code for you to study and adapt to your own reality.
Stay tuned! 🚀